


Last updated: May 31, 2026
The article:write skill is for writing new articles from topic briefs. This task is expanding an existing article with reviewer feedback – I’ll proceed directly.
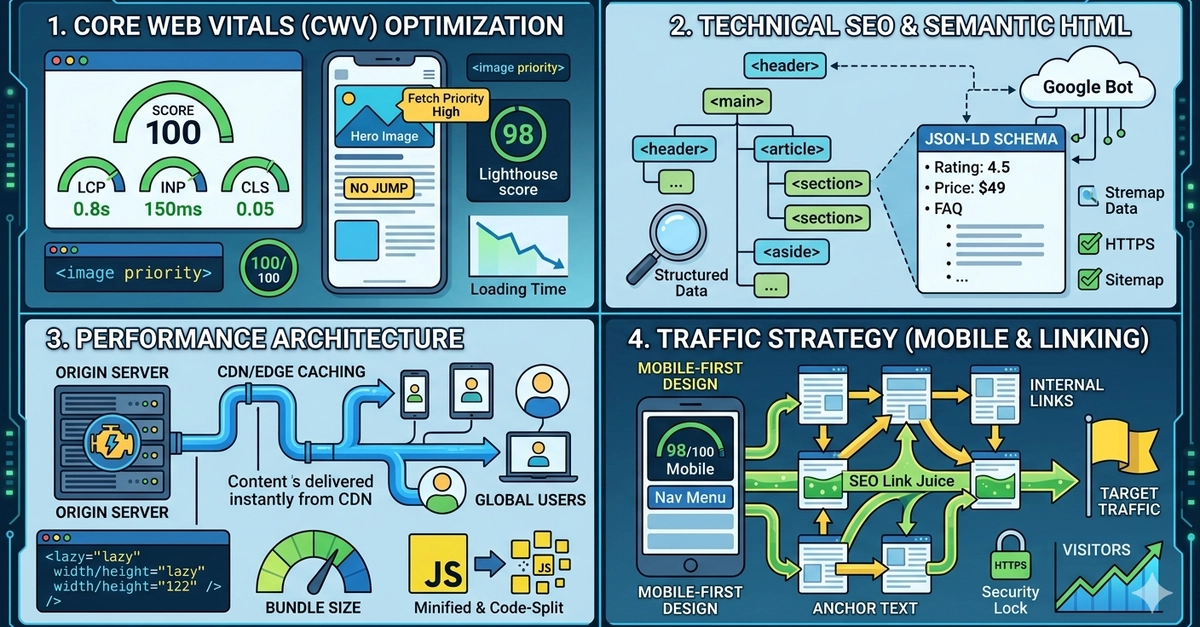
Image: Putu Adi / DEV Community
Here is what has changed for developers right now: INP remains the metric most teams are failing quietly, field data from real users is weighted more heavily than ever in Google’s ranking signals, and third-party scripts are silently eating performance budgets while lab tests say everything is fine. If you have not audited what a tag manager, a chat widget, or an ad network is doing to your main thread, that is the most likely reason your CrUX data looks worse than your Lighthouse score.
If your website loads in under three seconds, you might assume you are fine. Wrong assumption. Core Web Vitals in 2026 measures not just how fast your page loads, but how quickly it responds to every tap and click, and whether your layout stays still while it does so. Miss any one of these three signals and you are handing traffic – and conversions – to competitors who bothered to optimise.
This is not abstract algorithm chasing. Performance gaps translate directly into lost revenue. A 100ms delay in page response time correlates with measurable drops in conversion rate. The three Core Web Vitals – Largest Contentful Paint (LCP), Interaction to Next Paint (INP), and Cumulative Layout Shift (CLS) – are Google’s attempt to capture real user experience in measurable, actionable numbers.
What Are Core Web Vitals 2026 and What Do the Targets Actually Mean?

Image: Putu Adi / DEV Community
Each metric has a specific threshold that splits “good” from “needs improvement”. LCP must be under 2.5 seconds – this measures how long before the largest visible element (typically a hero image or headline) renders on screen. INP must be under 200ms – this captures the full duration of any user interaction, from button press to visible response. CLS must be under 0.1 – this quantifies how much the page layout shifts unexpectedly while loading.
INP replaced First Input Delay (FID) as the official responsiveness metric on March 12, 2024. FID only measured the delay before the browser began processing the first interaction. INP is stricter: it measures the complete response time of every interaction across the entire page session. A checkout button that stalls for 400ms on click is an INP failure, even if your very first click was instantaneous.
Think of it like a restaurant review. FID was the reviewer noting how quickly a waiter approached the table. INP is a full assessment covering every interaction throughout the meal – ordering, asking for the bill, requesting changes. A fast greeting does not compensate for a 10-minute wait every time you ask for something.
How to Fix LCP, INP, and CLS in Practice
These three metrics each have distinct root causes and distinct fixes. Getting all three passing requires separate strategies.
LCP is almost always an image problem. Switch hero images to AVIF or WebP formats and add fetchpriority="high" to the <img> tag. This tells the browser to prioritise fetching that element above almost everything else. Before: a hero JPEG loading at 3.1 seconds. After: the same image in AVIF with priority hints, loading at 1.8 seconds. Server-side rendering (SSR) and static site generation (SSG) also improve LCP by delivering pre-built HTML that browsers and search bots can parse immediately, without waiting for JavaScript to execute. If you are using WordPress in a headless configuration, WordPress as a headless CMS can unlock SSR benefits while preserving your existing content workflows.
INP failures trace to long tasks blocking the main thread. JavaScript that runs in one uninterrupted 600ms chunk will cause every interaction during that window to feel frozen. The fix is task splitting: use requestIdleCallback to defer non-urgent work, dynamic imports to load code only when needed, and setTimeout with a 0ms delay to break up synchronous loops. Before: a product filter that calculates results in a single 450ms synchronous function. After: the same filter split across microtasks, completing in 180ms with the UI remaining responsive throughout.
Third-party scripts deserve their own audit here. A single tag manager firing three analytics tags, a live chat widget, and a retargeting pixel can add 800ms to your main thread budget before your own code runs a single line. Inventory every third-party script, load non-critical ones with async or defer, and use a Content Security Policy to prevent ad networks from injecting additional payloads at runtime.
CLS: It Is Not Just Images
CLS gets oversimplified. Yes, setting explicit width and height attributes on every image and video element is the most common fix – and it is the right starting point. Without those attributes the browser allocates no space until the asset loads, then shoves everything else down the page. But images are only one cause.
Fonts are a frequent offender. When a custom web font loads after the browser has already rendered text in a fallback typeface, the swap can shift an entire paragraph block. The fix is font-display: optional for non-critical fonts (which suppresses the swap entirely if the font has not loaded in time) or font-display: swap combined with size-adjust descriptors to make the fallback metrics closely match your custom font.
Ads, embeds, and iframes shift layout when they inject content of unpredictable height. The solution is a reserved container: wrap every ad slot or embed in a <div> with a fixed minimum height that matches the expected content dimensions. If the content loads smaller, the reserved space holds. If it loads larger, you have a defined overflow boundary.
Consent banners and injected UI are among the most avoidable CLS sources. A cookie banner that slides in from the bottom after content has rendered, or a personalisation panel that injects above the fold after load, can each produce a CLS spike of 0.15 or higher from a single element. Reserve the space in the initial HTML layout – render a placeholder of the correct height – and fill it once the component is ready.
Measuring What Actually Matters: Field Data and Lab Data Together
Lab scores and field scores measure different things. Lighthouse runs a single synthetic test in controlled conditions. CrUX (Chrome User Experience Report) aggregates anonymised real-user data from Chrome across all device types and connection speeds. A site can score 90 in Lighthouse and still fail CrUX thresholds because the long tail of slower mid-range devices simply does not appear in lab simulations.
A practical measurement workflow combines both. Run Lighthouse in Chrome DevTools with CPU and network throttling enabled to catch obvious regressions during development. Then cross-reference with CrUX field data, available in PageSpeed Insights under “Discover what your real users are experiencing”, or directly via the CrUX API. If your lab score is 85 and your field LCP is 3.2 seconds, the discrepancy points to a resource loading differently for real users – typically a font, a lazy-loaded image above the fold, or a third-party script executing out of sequence.
For production attribution, a Real User Monitoring (RUM) library such as the open-source web-vitals JavaScript package lets you capture INP, LCP, and CLS data per page, per device type, and per user segment, then send it to any analytics endpoint. This is how you find that your checkout page fails INP on Android devices with 4G connections – a failure invisible in any lab test, but costing you conversions every day.
The Mobile Gap Most Developers Are Not Accounting For
Only 43% of mobile origins pass all three Core Web Vitals thresholds, compared to 54% on desktop, according to the HTTP Archive Web Almanac 2024. That gap exists because most performance testing happens on developer machines running Chrome on fibre broadband. Real mobile users are on mid-range devices with throttled CPUs and variable network connections.
The myth worth busting: “My PageSpeed score is 90 on mobile, so I’m fine.” PageSpeed Insights simulates a single device and connection. Field data from CrUX aggregates real user sessions across all devices. A site can score 90 in lab tests and still fail field data thresholds because the simulation does not capture the long tail of slower devices.
Structured data is another area where developers leave measurable gains untouched. Adding JSON-LD markup for FAQs, products, and reviews enables rich results in search – FAQ snippets, star ratings, price ranges – directly increasing click-through rates without any change to the underlying page speed. It does not affect Core Web Vitals scores directly, but it amplifies the traffic you receive from the rankings those scores help you achieve. For a broader approach to technical and content optimisation together, the 2026 website optimisation checklist is worth working through systematically.
Putting It All Together
The question this article opened with was whether a three-second load time is good enough. The real answer depends on three numbers: your LCP, your INP, and your CLS – measured in field data, not just a lab run. A site can load in 2.4 seconds and still fail INP because a bloated third-party script monopolises the main thread. It can pass LCP and INP and still fail CLS because a font swap or a late-loading consent banner shifts the layout at the last moment.
Core Web Vitals in 2026 rewards developers who treat performance as a discipline rather than a checkbox. Measure with real field data, not just lab scores. Fix image formats and priority hints for LCP. Split long tasks and audit third-party scripts for INP. Set dimensions on every media element, address font loading, and reserve space for ads and banners for CLS. The 57% of mobile sites still failing at least one threshold are leaving their rankings – and their users’ patience – on the table.
If you are planning a new build or a significant overhaul and want to understand what a well-optimised site actually costs, WordPress development pricing is a useful starting point for scoping the investment before you begin.
DRS Web Development builds custom websites and web applications for businesses of all sizes, with performance-first development built in from the start rather than bolted on at the end. Get in touch for a free consultation and find out what a properly optimised site could do for your search visibility and conversion rates.
Frequently Asked Questions
Q: What is the INP target for Core Web Vitals in 2026?
A: INP (Interaction to Next Paint) must be under 200ms to score “good”. Scores between 200ms and 500ms are flagged as “needs improvement”, and anything above 500ms is considered poor. INP replaced FID as the official responsiveness metric in March 2024 and measures the full duration of every user interaction, not just the first.
Q: How do I fix Cumulative Layout Shift (CLS)?
A: Start by setting explicit width and height attributes on all images and video elements. Then address font loading with font-display: optional or size-adjust descriptors, reserve fixed-height containers for ad slots and embeds, and render placeholders for consent banners rather than injecting them after load. A CLS score below 0.1 is considered good by Google’s standards.
Q: Why do mobile Core Web Vitals scores lag behind desktop?
A: Mobile devices typically have slower CPUs and more variable network connections than desktop machines. Lab tests often simulate ideal conditions, while field data from real users on mid-range phones reveals a significant gap. Only 43% of mobile origins pass all three Core Web Vitals thresholds, versus 54% on desktop.
Q: Does structured data (JSON-LD) affect Core Web Vitals scores?
A: No – JSON-LD structured data does not directly affect LCP, INP, or CLS scores. However, it enables rich search results such as FAQ snippets, star ratings, and product listings, which increase click-through rates from search pages and amplify the traffic you gain from good Core Web Vitals rankings.
Q: What is the difference between SSR and SSG for improving LCP?
A: Server-side rendering (SSR) generates HTML on each request; static site generation (SSG) pre-builds HTML at deploy time. Both deliver pre-rendered HTML that browsers and search bots can read immediately without waiting for JavaScript execution, which directly improves LCP by reducing the time before the largest element renders.
Q: How do I know if my Core Web Vitals field data differs from my lab scores?
A: Compare your Lighthouse scores (lab data) against the field data section in PageSpeed Insights, which pulls from CrUX. If your lab LCP is 1.9 seconds but your field LCP is 3.1 seconds, the difference usually points to a resource loading differently for real users – a third-party script, a late-loading font, or a lazy-loaded image sitting above the fold.
Source: https://dev.to/disann/seo-website-perfomance-48lg
This article was researched and written with AI assistance, then reviewed for accuracy and quality. Riya Shah uses AI tools to help produce content faster while maintaining editorial standards.
Need help with your web project?
From one-day launches to full-scale builds, DRS Web Development delivers modern, fast websites.

